
This Excel tutorial explains how to create Pivot Table using Excel VBA, set Print Area for Pivot Table
Create Pivot Table using Excel VBA
Create Pivot Table using Excel VBA is very straight forward and easy to use. If you don’t understand any Object or Property that VBA Pivot Table uses, simply use “Record Macro” function to do recording to see the underlying VBA code behind each action, such as create Pivot Table, change Pivot Table Fields, select Critera, delete Pivot Table, etc.
In this post, I will summarize the code for the basic actions to save your time.
If you don’t know how to use “Record Macro” function, click to read the below article.
Create Empty Pivot Table
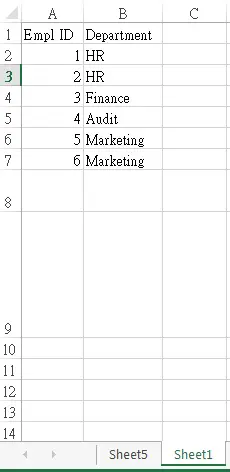
The follow example shows how to create a Pivot Table in Sheet5 A1, from data source in Sheet1 A1:B7
Source table:
Public Sub createPivot()
    ActiveWorkbook.PivotCaches. _
        Create( _
        SourceType:=xlDatabase, _
        SourceData:=Worksheets("Sheet1").Range("A1:B7")). _
            CreatePivotTable _
            TableDestination:=Worksheets("Sheet5").Range("A1"), _
            TableName:="PivotTable1"
End Sub
| VBA Code | Type | Meaning | Example |
| PivotCaches | Object | Pivot Table stores its source data and workings in cache memory called PivotCaches, in order that Pivot Table can run faster | |
| Source Type | Property | Type of data source, parameters include: xlConslidation xlDatabase xlExternal xlPivotTable xlScenario |
xlDatabase |
| Source Data | Property | Where the source data locate | Worksheets(“Sheet1”).Range(“A1:B7”) |
| TableDestination | Property | Where the Pivot Table is to be placed | Worksheets(“Sheet5”).Range(“A1”) |
| TableName | Property | The name for Pivot Table | PivotTable1 |
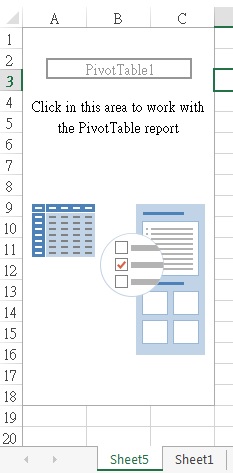
Below is the result you will get from the code, just an empty Pivot Table with no fields.
Add PivotFields to Pivot Table
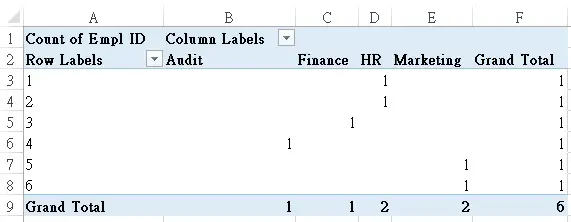
Now try to add Employee ID to Row, Audit to Column, and then Count Employee ID.
Public Sub createPivot()
    ActiveWorkbook.PivotCaches. _
        Create( _
        SourceType:=xlDatabase, _
        SourceData:=Worksheets("Sheet1").Range("A1:B7")). _
            CreatePivotTable _
            TableDestination:=Worksheets("Sheet5").Range("A1"), _
            TableName:="PivotTable1"
        Set PT = Worksheets("Sheet5").PivotTables("PivotTable1")
        With PT.PivotFields("Empl ID")
            .Orientation = xlRowField
            .Position = 1
        End With
        With PT.PivotFields("Department")
            .Orientation = xlColumnField
            .Position = 1
        End With
         With PT.PivotFields("Empl ID")
            .Orientation = xlDataField
            .Position = 1
            .Function = xlCount
        End With
End Sub
The above code is very straight forward and easy to understand, each color represents each set of actions.
The first action is to add Row, then add Column, finally add Data and apply aggregate function “count”. (default is “sum” if Function Property is omitted for DataField)
If you want to add multiple column / row, just copy the code from “With” to “End With”, then change the PivotFields name and then change Position number to increase by 1.
| VBA Code | Type | Meaning | Example |
| PivotFields | Object | Column data in your data source | Empl ID, Department |
| Orientation | Property | Where you want to place your column data, parameters include: xlRowField (Rows) xlColumnField (Columns) xlPageField (Filter) xlDataField (Values) xlHiddenFields |
|
| Position | Property | The order of Orientation | If both Empl ID and Department are added as xlColumnField, data will group by position 1 and then by position 2 |
| Caption | Property | Rename PivotField. You can see the new name in the Pivot Table if using 2003 layout | |
| Function | Property | Aggregate function or statistics function of the data field, parameter include xlAverage xlCount xlCountNums (count numeric values) xlMax xlMin xlProduct (multiply all data) xlStDev (standard deviation of sample) xlStDevP (standard deviation of population) xlSum xlVar (variance of sample) xlVarP (variance of population) |
Set Print Area for Pivot Table using VBA
Sub printPivot()
 ActiveSheet.PivotTables("PivotTable1").PivotSelect "", xlDataAndLabel, True
 ActiveSheet.PageSetup.PrintArea = Selection.Address
End Sub
What’s Next?
Now you have created a Pivot Table below, which is known as a “Compact Layout”. If you remember in Excel 2003, the layout is quite different (at least 2003 does not have “Row Labels” and “Column Labels”).
Read the below article to change a different layout.
Change Pivot Table Layout using VBA
Outbound References
http://msdn.microsoft.com/en-us/library/office/aa215695%28v=office.11%29.aspx