
This Excel tutorial explains how to calculate sample covariance using COVARIANCE.S and calculate population covariance using COVARIANCE.P
Covariance
Covariance is a measure of how much two random variables change together.
The below formula is for calculation of Population Covariance. For Sample Covariance, divide n-1 instead of N.
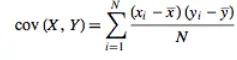
While σx is denoted as standard variation of x, σxy is denoted as Covariance.
After we calculate the covariance, we can check the sign whether it is negative or positive. Positive covariance means positive relationship (y increases as x increases), negative covariance means a negative relationship (y decreases as x increases). However, we cannot see the strength of relationship.
Covariance – Manual calculation
Assume B2 to B4 are the source data of variable x and y, when x increases, y also increases.
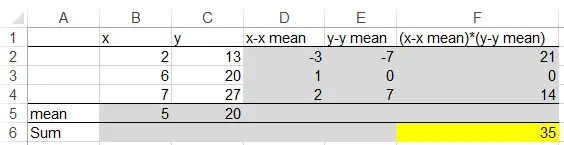
The gray cells are Excel formula, you can easily create a table as above. The final figure we need from the above table is the yellow cell.
Now we can apply the formula to calculate sample covariance and population covariance
Population covariance = 35/N = 35/3 =11.7
Sample covariance = 35/n-1 = 35/2 =17.5
If we invert the y data so that y decreases with x, then
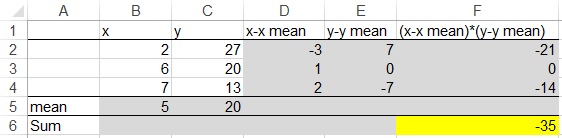
Population covariance = -35/N = -35/3 =-11.7
Sample covariance = -35/n-1 = -35/2 =-17.5
If y is constant, then
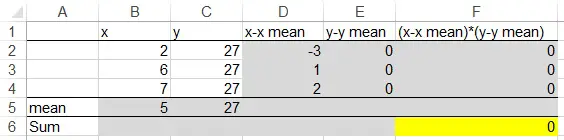
Population covariance = 0
Sample covariance = 0
We can tell from the sign of covariance that positive covariance is a positive relationship, negative covariance is negative relationship, zero covariance is no relationship, but we cannot tell the strength of the relationship by looking at the number.
COVARIANCE.S and COVARIANCE.P Functions
Calculating covariance using Excel formula is very straight forward.
Covariance.S is to calculate sample covariance, while Covariance.P is to calculate population covariance. Both functions have two parameters
Covariance.S(array1, array2)
Covariance.P(array1, array2)
array1 is the variable x data set, while array2 is the variable y data set. Using the below dataset as an example
| Formula | Result | |
| Population Covariance | =COVARIANCE.P(B2:B4,C2:C4) | 11.66667 |
| Sample Covariance | =COVARIANCE.S(B2:B4,C2:C4) | 17.5 |