
This Excel tutorial explains how to set Excel graph dynamic data range.
You may also want to read:
Excel dynamic Data Validation list
Excel graph dynamic data range
The purpose of Excel graph dynamic data range is to select data range based on how many data you have input instead of using a fixed range.
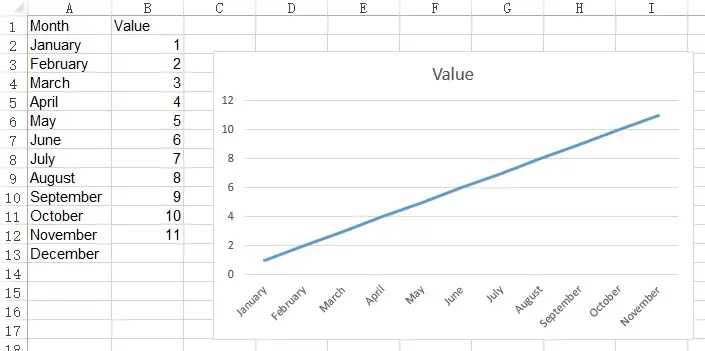
Assume that you have the data set below.
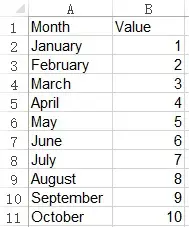
You can draw a graph from January to October easily by selecting A1 to B11, but if you do that, you need to select the data range every time for a new month.
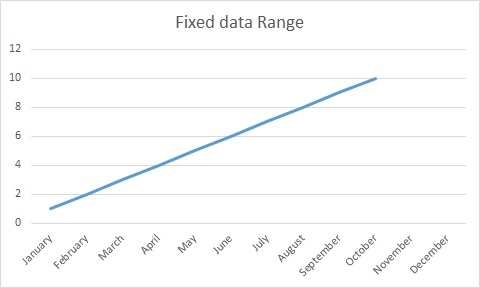
When you create a chart using the below data set
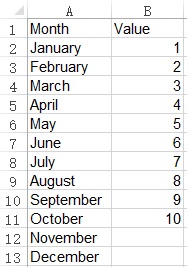
The line will stop in November.
But for some chart types, Null data is defaulted to 0, resulting in a sudden drop.
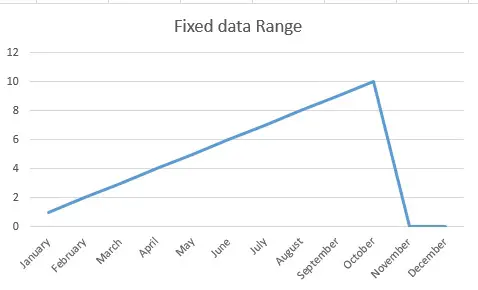
The best solution is to create a dynamic data range that allows the data to expand automatically based on column B.
Create Excel graph dynamic data range
To dynamically create a data range, create a Name Range for each column A and B respectively, where last row of A depend on B.
To create a dynamic range for column A,
Click on Formulas tab > Name Manager > New
Under Refers to, type the below formula and name the Range as A
=OFFSET(Sheet1!$A$2,0,0,SUMPRODUCT(MAX((Sheet1!$B:$B<>"")*ROW(Sheet1!$B:$B)))-1,1)
If you don’t understand the OFFSET function, click here to view my previous post.
But simply speaking, the syntax of OFFSET function is as below
OFFSET( reference, rows, columns, [height], [width])
Afterwards, create another Range for column B as below, and name the range as B.
=OFFSET(Sheet1!$B$2,0,0,SUMPRODUCT(MAX((Sheet1!$B:$B<>"")*ROW(Sheet1!$B:$B)))-1,1)
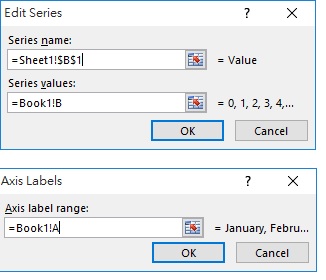
Create a graph with data range from A1 to B13
Right click on the graph > Select Data
Edit the horizontal and vertical data range as below.
Now you get the below graph with Nov and Dec hidden.
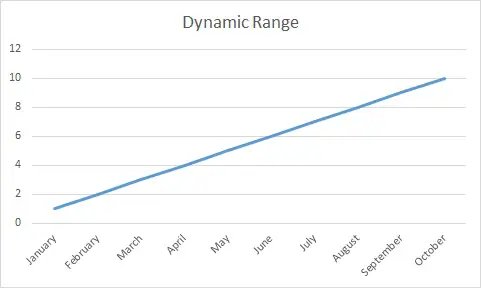
Whenever you type a value in column B, the chart is updated automatically.
Outbound References
https://support.microsoft.com/en-us/kb/830287