
This Excel tutorial explains how to measure variability using Range, Variance, Standard Deviation.
You may also want to read:
Excel calculate Covariance, Coefficient of Correlation
Excel Range, Variance, Standard Deviation
In the previous post, I have explained how to measure the central tendency using Mean, Mode, Median. In this tutorial, I will explain how to measure variability using Range, Variance, Standard Deviation. Variability is also known as dispersion, it is to measure of how data are spread out.
For example, data set 100, 130, 160 is less spread out than data set 1, 50, 100, 150, 200
Range
Range is the easiest way to describe dispersion using the below formula.
Range = largest observation - smallest observation
For data set 1, 3, 5, 7 Range = 7-1 = 6
Range only reflects the difference between largest and smallest observation, but it fails to reflect how data is centralized.
Interquartile Range
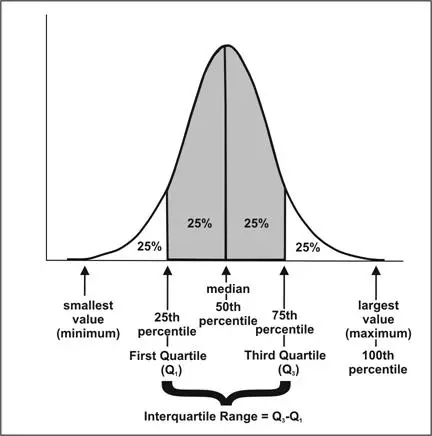
Another type of Range called Interquartile Range (IQR) which measures the difference between 75th and 25th observation using the below formula.
IQR = 75th percentile - 25th percentile
To understand how to calculate percentile, click here to read my previous post.
To calculate Interquartile Range in Excel, use either PERCENTILE.EXC or PERCENTILE.INC Function to separately calculate P25 and P 75, and then find the difference.
Excel Example
Suppose data set 1, 3, 5, 7 lie in Range A1:A4.
IQR = PERCENTILE.EXC(A1:A4,0.75)- PERCENTILE.EXC(A1:A4,0.25)
Variance
Variance is defined as the average of the squared differences from the Mean. There are two kinds of Variance – Sample Variance and Population Variance. Larger Variance means the data are more spread out.
Population Variance (used when the population is known)

Sample Variance (used when the population is unknown, using sample data to estimate the population)
![]()
Both of the above formula are basically the same except that Population Variance divides the result by N while Sample Variance divides the result by n-1.
Excel Example
You may use VAR.P to calculate Population Variance while VAR.S to calculate Sample Variance.
The syntax of both formula only contain one argument, which is the Range of value. For example
=VAR.P(A1:A10)
=VAR.S(A1:A10)
You can verify the result by multiplying VAR.P(A1:A10) by N and multiplying VAR.S(A1:A10) by n-1, the results are equal.
Standard Deviation
Standard Deviation is the square root of Variance (either Population Variance or Sample Variance).
In Excel, you can either use VAR.P or VAR.S and then square root the result, or directly use
=STDEV.P(A1:A10) for Population OR
=STDEV.S(A1:A10) for Sample
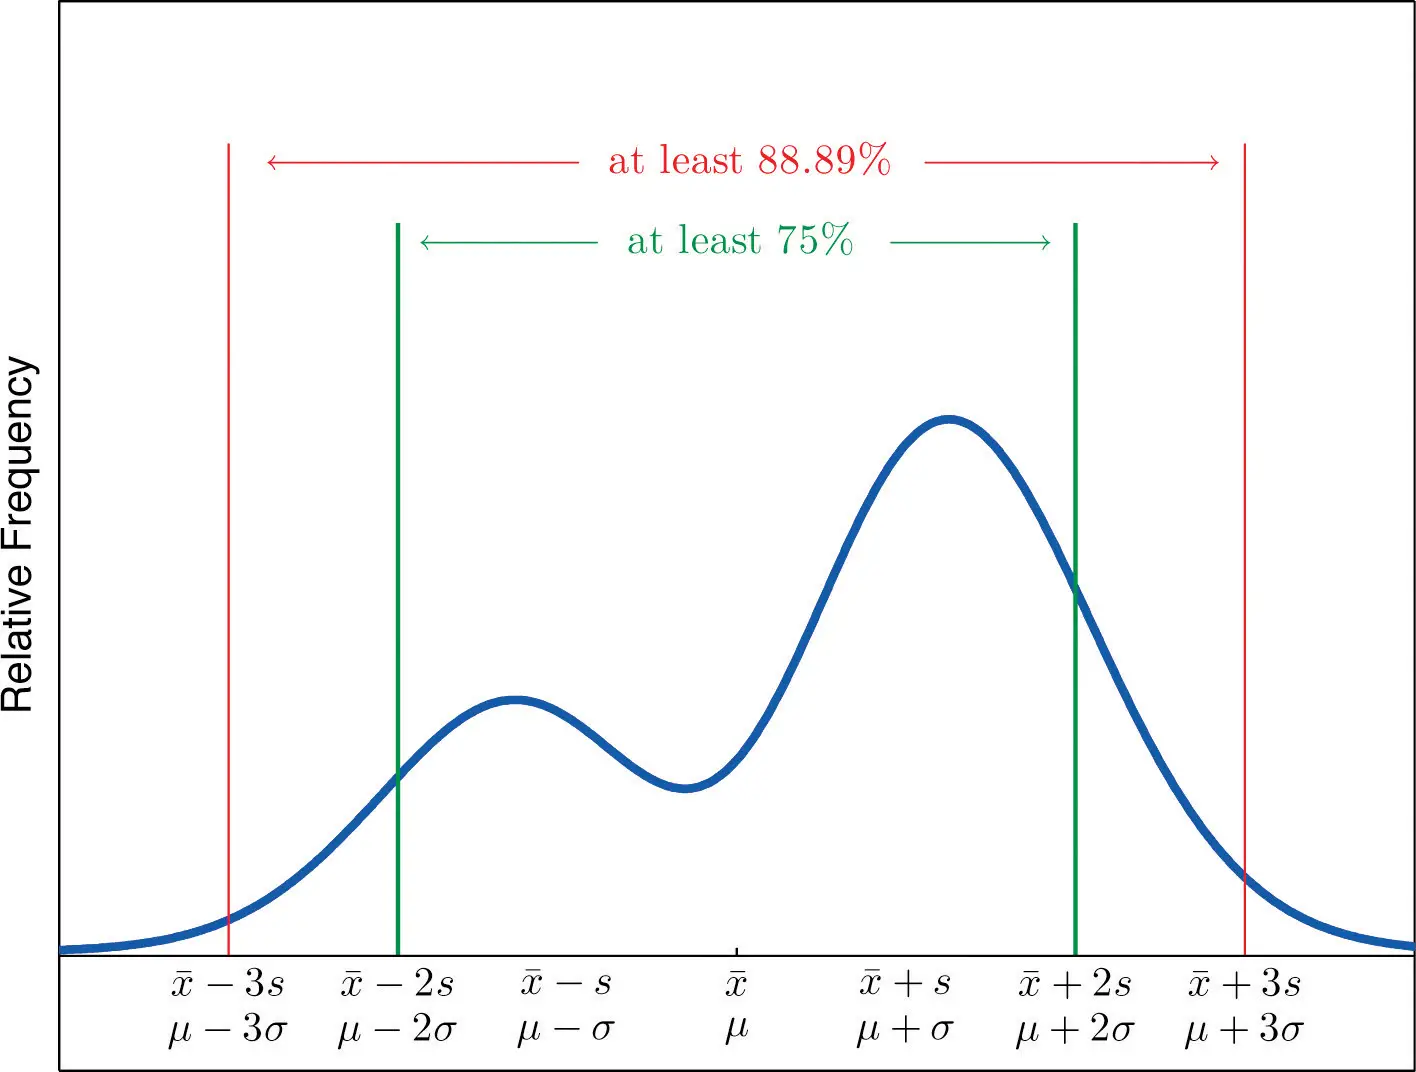
After calculating the Standard Deviation, we can use Chebysheff’s Theorem to interpret the number.
- at least 3/4 of the data lie within two standard deviations of the mean, that is, in the interval with endpoints x−±2s for samples and with endpoints μ±2σ for populations;
- at least 8/9 of the data lie within three standard deviations of the mean, that is, in the interval with endpoints x−±3s for samples and with endpoints μ±3σ for populations;
- at least 1−1/k2 of the data lie within k standard deviations of the mean, that is, in the interval with endpoints x−±ks for samples and with endpoints μ±kσ for populations, where k is any positive whole number that is greater than 1.
Outbound References
http://en.wikipedia.org/wiki/Variance