
This SPSS/Excel tutorial explains how to use Chi Squared Goodness of fit test in Excel, SPSS and manual calculation.
You may also want to read:
SPSS Excel Chi Squared Test of Contingency Table
Chi Squared Goodness of fit test
Chi Squared Goodness of fit test is used to test hypotheses about a population proportion of nominal data. A coin flipping experiment has the chance of tossing head and tail (p=0.5), we call the experiment binomial experiment, where we only have two possibilities and each trial is independent. For Chi Squared Goodness of fit test, it is a multinominal experiment where more than 2 possibilities can happen for each trial. We can use Chi Squared Goodness of fit test to evaluate if there is significant evidence of a proportion change.
Chi Squared Goodness of fit test – Manual Calculation
Assume that in 2010, supermarket A has the market share of 45%, supermarket B has 40%, supermarket C has 15%. In 2016 we conduct new survey to see if customer preferences have changed. Of the 200 customers we asked, 102 selects supermarket A, 82 selects supermarket B, 16 selects supermarket C. To evaluate if the proportion has a significant change, we create hypothesis:
Ho: p1 = 0.45, p2 = 0.4, p3 = 0.15
H1: At least one pi is changed
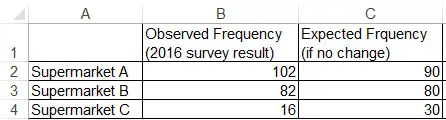
If the proportion has not changed, then in the 2016 survey, frequency of supermarket A should be 90 (200*0.45), B to be 80 (200*0.4), C to be 30 (200*0.15).
Apparently the actual frequency would not be exactly the same as the expected frequency, the point is we will see if the difference is significant.
Create a table as below and do some calculations for the blue columns.
| Observed Frequency (2016 survey result) |
Expected Frequency (if no change) |
Difference | square of difference/
expected frequency |
|
| Supermarket A | 102 | 90 | 12 | 1.6 |
| Supermarket B | 82 | 80 | 2 | 0.05 |
| Supermarket C | 16 | 30 | -14 | 6.53 |
| Chi Square = 1.6+0.05+6.533333 = 8.1833333 |
The next step is to calculate the probability of Chi Square value to see if it is <0.05. Since we cannot manually calculate the value, we have to use Excel Function CHISQ.DIST.RT. There are two arguments in this function, the first parameter is the Chi Square that we just calculated, the 2nd is the degree of freedom. The degree of freedom of Chi Squared Goodness of fit test is
v = n-1
In our example, we have 3 supermarkets, therefore degree of freedom is 3-1 = 2
Now apply the formula
| Formula | Result |
| =CHISQ.DIST.RT(8.18,2) | 0.016711358 |
Since the P value is <0.05, we conclude that there is significant evidence to infer that proportions have change in 2016 survey.
Chi Squared Goodness of fit test – using Excel
Assume that your source data is like this
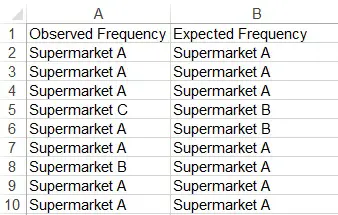
Use CountIf Function to create a summery table
| Observed Frequency (2016 survey result) |
Expected Frquency (if no change) |
|
| Supermarket A | =COUNTIF(A2:A201,”Supermarket A”) | =COUNTIF(B2:B201,”Supermarket A”) |
| Supermarket B | =COUNTIF(A2:A201,”Supermarket B”) | =COUNTIF(B2:B201,”Supermarket B”) |
| Supermarket C | =COUNTIF(A2:A201,”Supermarket C”) | =COUNTIF(B2:B201,”Supermarket C”) |
Now we can directly calculate the probability using CHITEST function.
There are two arguments for CHITEST Function. The first one is the observed frequency range, the second one is expected frequency range. Now apply the formula
| Formula | Result |
| =CHITEST(B2:B4,C2:C4) | 0.016711358 |
Chi Squared Goodness of fit test – using SPSS
The input requirement of SPSS is quite different from Excel.
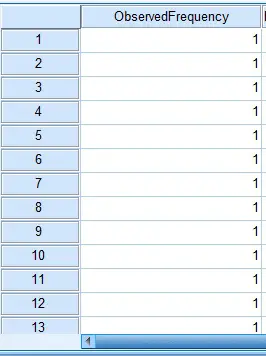
First, you need to have data source in numerical value instead of nominal value Supermarket A B C. Assign each supermarket a number, for example, Supermarket A represents 1, B for 2, C for 3.
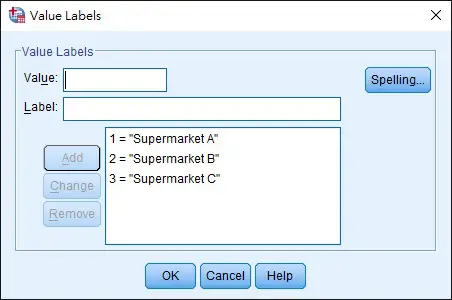
Then go to the Variable View tab, Values field to add a supermarket label for 1 2 3. This step is optional but it makes you easier to read the output file.
Go to the menu tab > Analyze > Non Parametric Tests > Legacy Dialogs > Chi-Square
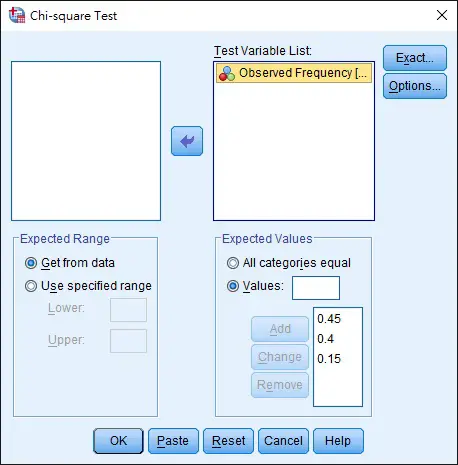
Move the “Observed Frequency” to the Test Variable List
At the bottom, type the Expected Frequency percentage in order of Supermarket A B C (because we have named them as 1,2,3 so the proportion has to follow the ascending order of numerical value).
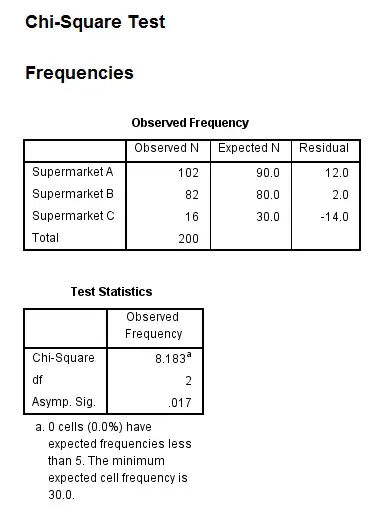
Now we have the Chi-Square value as well as the P value.