
This Excel / SPSS tutorial explains how to calculate Chi Squared Test of Contingency Table in Excel, SPSS and manual calculation.
You may also want to read:
Excel SPSS Chi Squared Goodness of fit test
SPSS Excel Chi Squared Test of Contingency Table
Chi Squared Test of Contingency Table is used to infer whether two nominal variables in the population are related. In Excel, Contingency Table is a Pivot Table where we have a variable in the column and a variable in row, and count the frequency that falls into the combination. Such table is also known as “cross-tab” or “matrix report”.
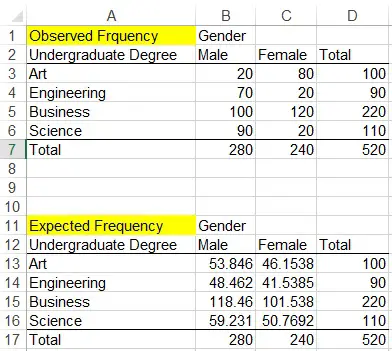
Below is an example of a cross-tab table, illustrating how many male and female for different undergraduate degree.
| Observed Frequency | Gender | ||
| Undergraduate Degree | Male | Female | Total |
| Art | 20 | 80 | 100 |
| Engineering | 70 | 20 | 90 |
| Business | 100 | 120 | 220 |
| Science | 90 | 20 | 110 |
| Total | 280 | 240 | 520 |
Chi Squared Test of Contingency Table – Manual Calculation
Using the above table as example, we want to evaluate if gender and the choice of undergraduate degree is related. We create a hypothesis as below
Ho: The the variables are independent
H1: The two variables are dependent
If Ho is true, then the number of male and female are same for each undergraduate degree, but it does not mean simply dividing the total by 2 for each degree, because we also have to consider the proportion of gender. In the sample, we have 280 males and 240 females, the proportion for male is 280/520 = 0.538. For female, it is 240/520 = 0.4615.
There are 100 Art students, ideally there would be 100*0.538= 53.8 males and 100*0.4615 = 46.15 females. Now calculate the expected frequency for each undergraduate degree and we have the below result.
| Expected Frequency | Gender | ||
| Undergraduate Degree | Male | Female | Total |
| Art | 53.846 | 46.1538 | 100 |
| Engineering | 48.462 | 41.5385 | 90 |
| Business | 118.46 | 101.538 | 220 |
| Science | 59.231 | 50.7692 | 110 |
| Total | 280 | 240 | 520 |
For each observed frequency and expected frequency, do summation of (Observed Frequency-Expected Frequency)2/ Expected Frequency, the result is Chi-Square value.
| Art Male | 21.27472527 | |
| + | Engineering Male | 9.572649573 |
| + | Business Male | 2.877122877 |
| + | Science Male | 15.98401598 |
| + | Art Female | 24.82051282 |
| + | Engineering Female | 11.16809117 |
| + | Business Female | 3.356643357 |
| + | Science Female | 18.64801865 |
| Total | Chi Square value | 107.7017797 |
The next step is to calculate the probability of Chi Square value to see if it is <0.05. Since we cannot manually calculate the value, we have to use Excel Function CHISQ.DIST.RT. There are two arguments in this function, the first parameter is the Chi Square that we just calculated, the 2nd is the degree of freedom. The degree of freedom of a contingency table is
v = (r-1)(c-1) = (4-3)(2-1) = 3
Now apply the formula
| Formula | Result |
| =CHISQ.DIST.RT(107.7017797,3) | 3.42677E-23 |
Note that 3.42677E-23 means 3.4*10-23
Since the P value is <0.05, we conclude that there is significant evidence that there is a relationship between undergraduate degree and gender.
Chi Squared Test of Contingency Table – using Excel
Given that we have created the below table
There are two arguments for CHITEST Function. The first one is the observed frequency range, the second one is expected frequency range. Now apply the formula
=CHITEST(B3:C6,B13:C16)
We get the result 3.42677E-23
Chi Squared Test of Contingency Table – using SPSS
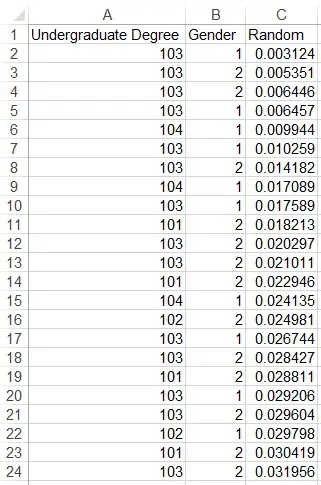
Since SPSS only allows analysis using numeric values, we need to use number to represent the degree and gender, and then input the mapping in Value Label in SPSS.
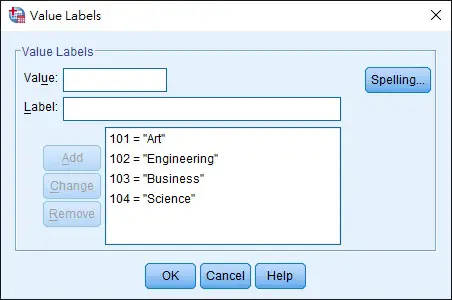
For example, we decide a mapping like this
| Numeric value | Mapping |
| 101 | Art |
| 102 | Engineering |
| 103 | Business |
| 104 | Science |
| 1 | Male |
| 2 | Female |
And we have a data source in numeric values
In SPSS, go to the Variable View tab, Values field to input the mapping for both variables.
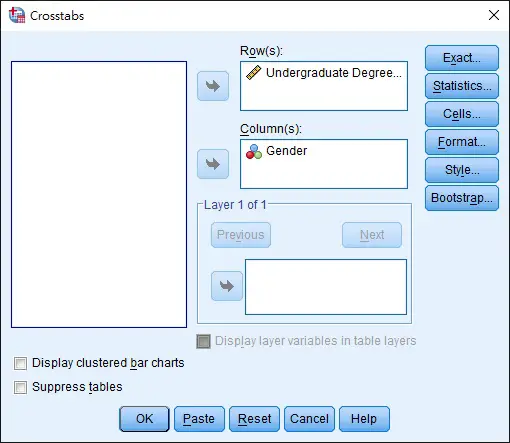
In the menu bar, navigate to Analyze > Descriptive Statistics > Crosstabs, select the Row and Column as below.
Click on Statistics button and check the box Chi-Square
Click on Cells button and check the box Expected
Finally click on OK to export the result
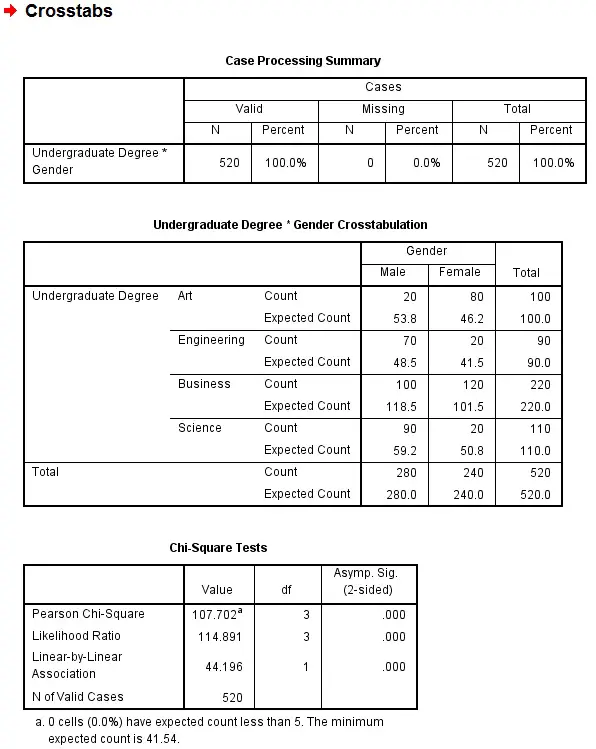
In the result, you can see the Chi-Square value is 107.702, and the probability is 0.000 since the value is too small to show. The actual value should be 3.4*10-23