This SPSS Excel tutorial explains how to calculate Covariance, Correlation and Least Squares Method in Excel and SPSS.
Covariance and Correlation
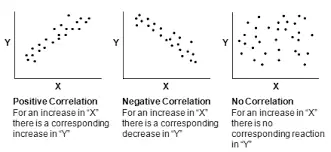
When we plot a scattered graph to see the relationship between two interval variables, we can see how straight a line is formed (whether the relationship is strong) and whether the relationship is positive or negative (upward or download).
However, when we want to look deeper to see the strength of the relationship, we need to calculate covariance and correlation. Covariance is a process to help us find the Correlation, which is the number we ultimately need for the strength.
Covariance
The below formula is for calculation of Population Covariance. For Sample Covariance, divide n-1 instead of N.
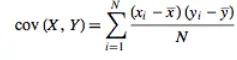
While σx is denoted as standard variation of x, σxy is denoted as Covariance.
After we calculate the covariance, we can check the sign whether it is negative or positive. Positive covariance means positive relationship (y increases as x increases), negative covariance means a negative relationship (y decreases as x increases). However, we cannot see the strength of relationship at this point.
Calculate Covariance in Excel
For sample covariance
=COVARIANCE.S(array1, array2)
For population covariance
=COVARIANCE.P(array1, array2)
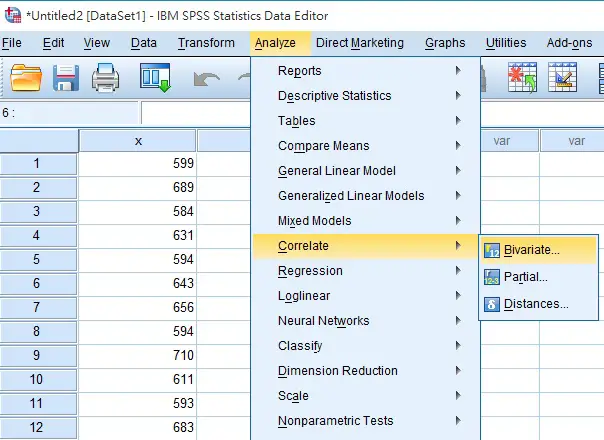
Calculate Covariance in SPSS
Note that SPSS can only calculate sample Covariance.
Navigate to Analyze > Correlate > Bivariate
Move x and y to the right hand side
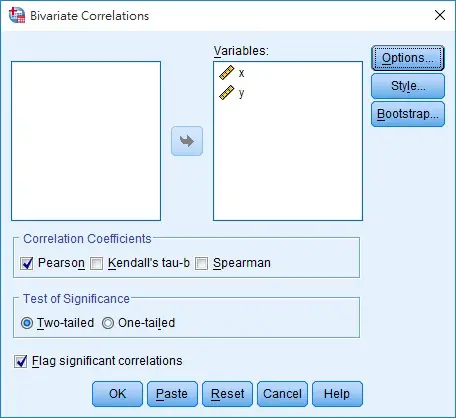
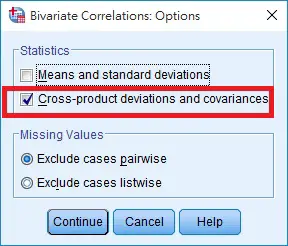
Click on Option, and then check the box Cross-product deviations and covariances
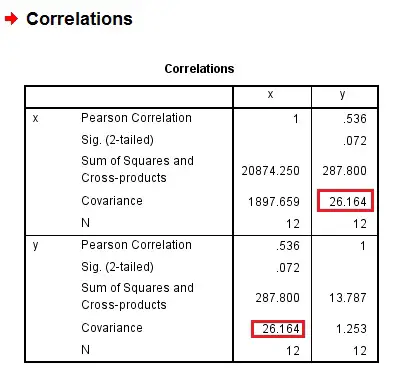
In the output table, 26.164 is the sample covariance. 1897.659 on the left is the variance of x.
The significance level (2 tailed) < 0.05 means there is a statistically significant correlation between two variables.
Coefficient of Correlation
Again, Covariance is just a step to calculate correlation. The next step is to calculate Coefficient of Correlation using Covariance.
Formula of Population coefficient of correlation: (σ is the standard deviation)
ρ = σxy / (σx * σy)
Sample coefficient of correlation:
r = Sxy / (Sx * Sy)
The calculated result of Coefficient of Correlation ranges between -1 and 1. The positive sign indicates positive relationship while negative sign indicates negative relationship.
In addition, 1 indicates the strength of linear relationship is very strong, 0 indicates no linear relationship.
Calculate Coefficient of Correlation in Excel
=CORREL(array x, array y)
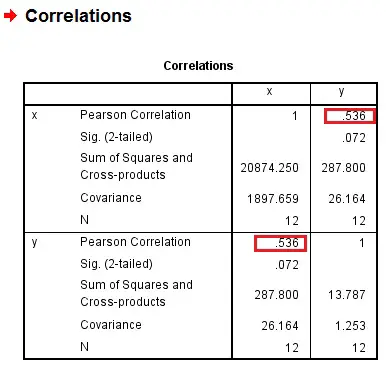
Calculate Coefficient of Correlation in SPSS
You can find the Correlation in the above output table.
Least Squares Method
Least Squares Method is to find the linear equation of best fit line for the x and y.
The equation of best fit line is
mean of y = slope * (mean of x) + constant
To create the equation, first calculate the slope of the straight line
slope = covariance x y / variance of x
Afterwards, substitute mean of x and mean of y to find constant.
Calculate slope in Excel using Slope Function
=SLOPE(array y, array x)
or calculate indirectly
=COVARIANCE.S(array x, array y)/VAR.S(array y)
Calculate constant in Excel using Intercept Function
=INTERCEPT(array y, array x)
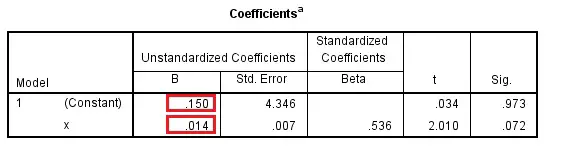
Calculate slope and constant in SPSS
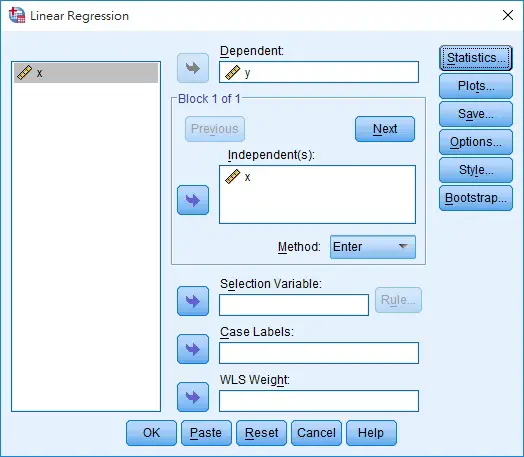
Navigate to Analyze > Regression > Linear
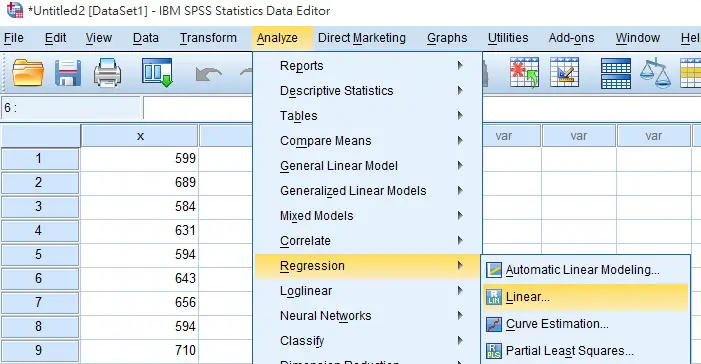
Select y as Dependent variable and x as Independent variable, click on OK
In the output, one of the table is called Coefficients, where you can find the constant is 0.15 and slope is 0.14