
This SPSS Excel tutorial explains how to conduct Paired Samples T Test in Excel and SPSS.
Paired Samples T Test
In statistical inference, we are interested to know whether a small sample comes from a population. To inference using sample mean, when the population standard deviation and population mean are known, we can use Z test to interference the population mean from sample mean.
In reality, we do not have data of the whole population. Without the population standard deviation, we use T Test (also known as Student’s t Test) to interference the population mean from sample mean.
There are basically three kinds of T Test in statistics:
| One sample T Test | Test whether a target mean value is equal to the population mean |
| Independent sample T Test | Test whether the population mean from two individual samples are equal. For two samples, you can also use One Way ANOVA, but ANOVA is not directional. |
| Paired-samples T Test | Test whether the population mean between paired observations are equal |
One of the typical use of Paried-samples T Test is to test the same group before and after a treatment, in order to determine if the change is significant (whether the treatment is effective). Paired-samples T Test is also known as Dependent sample T Test.
Paired Samples T Test – using Excel
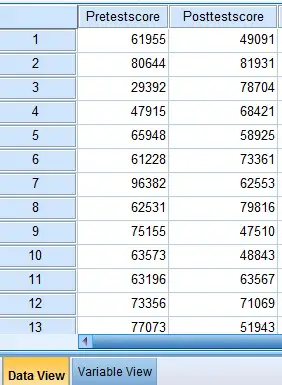
Assume we have pretest score and posttest score as below.
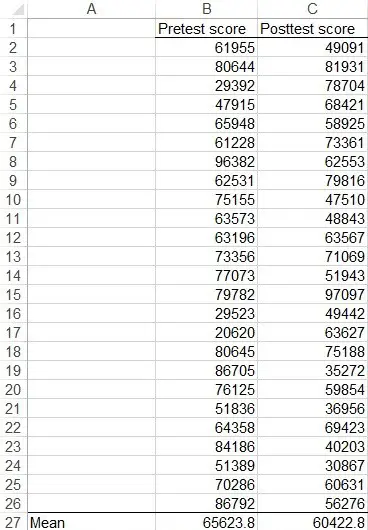
We set the hypothesis as below
Ho: the mean pretest score is not different from the posttest score
H1: the mean pretest score is different from the posttest score
Before we use Excel to test, make sure you have installed Data Analysis Add-in.
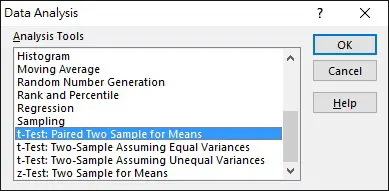
Navigate to Data tab > Data Analysis > t-Test: Paired Two Sample for Means
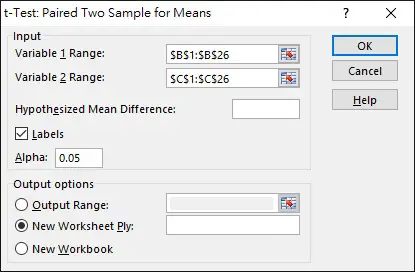
Select data Range. Note that Variable 1 Range has to be sample of larger mean. Click on OK to generate the result.
In the result, we are interested in looking at t Statistics and t Critical two-tail value.
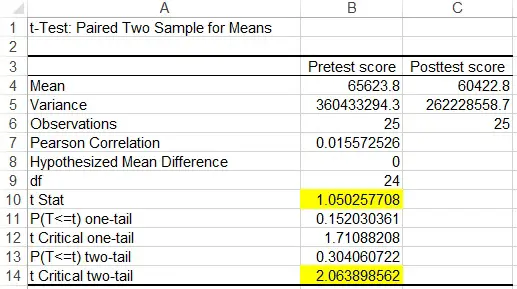
Since t Stat <t Critical two-tail value, we cannot reject H0, meaning the pretest and posttest mean score are not significantly different.
You can also use Excel T.Test Function to directly get the P value.
Paired Samples T Test – using SPSS
Prepare Dataset as below
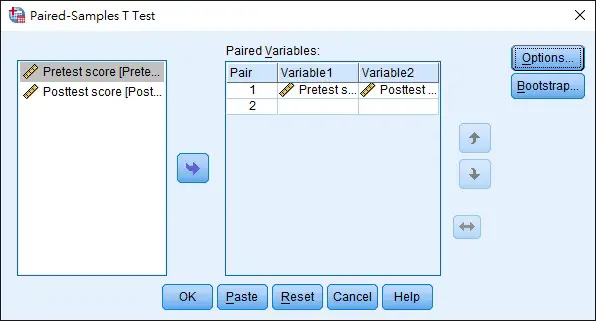
Navigate to Analyze tab > Compare Means > Paired-Samples T Test
Select Variable 1 as Pretest and Variable 2 as Posttest > OK
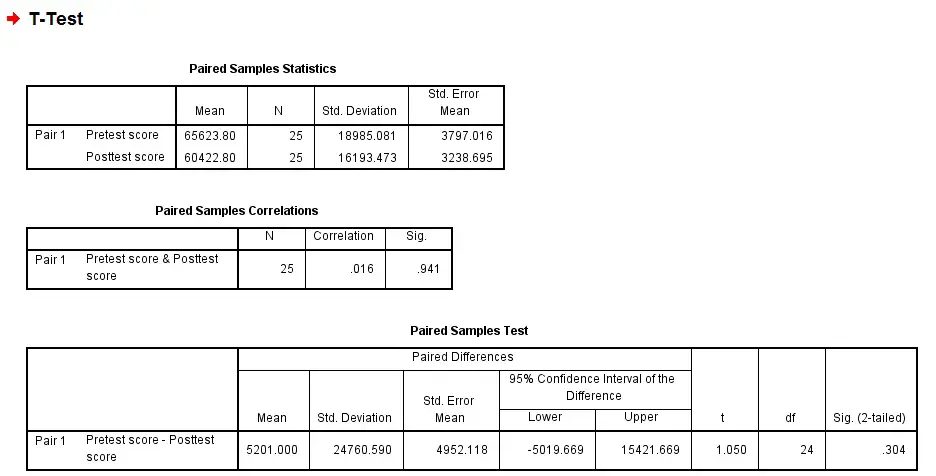
From the Paired Samples Test table, the p value for 2 tailed is 0.304, which is greater than alpha value 0.05, therefore we cannot reject Ho, meaning the pretest and posttest mean score are not significantly different.
If we need to do one-tailed, divide p value 0.304 by 2 and compare with 0.05. Assume that our hypothesis is to test if Pretest score > Posttest score, we cannot reject H0 since p value 0.152 is greater than 0.05.