
This tutorial explains how to calculate Z Score and probability using SPSS and Excel.
You may also want to read
Calculate probability of a range using Z Score
Calculate Z Score and probability using SPSS and Excel
In statistical inference, we are interested to know whether a small sample comes from a population. To inference using sample mean, when the population standard deviation and population mean are known, we can use Z test to interference the population mean from sample mean.
In reality, we do not have data of the whole population. Without the population standard deviation, we use T Test (also known as Student’s t Test) to interference the population mean from sample mean.
Use Excel to calculate Z Score
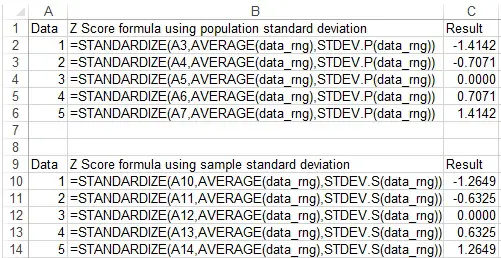
There are two ways for Excel to calculate Z Score. Assume that we have a population data range named data_rng.
Method 1: Use AVERAGE and STDEV.P Functions
If we calculate Z Score manually, we use the below formula
Z score = (X-μ)/σ
        = (target value - population mean) / population standard deviation
Follow the Z score formula with the help of Average Function to calculate mean and use STEDEV.P to calculate the population standard deviation. If you want to calculate sample standard deviation, use STEDEV.S
For example, type the below formula to find Z score for X = 10
=(10-AVERAGE(data_rng))/STDEV.P(data_rng)
Method 2: Use Standardize Function
Syntax of Standardize Function
STANDARDIZE(x, mean, standard_dev)
This Function is a bit cleaner than Method 1, but we still need the help of AVERAGE and STDEV.P Functions.
For X = 10
=STANDARDIZE(10,AVERAGE(data_rng),STDEV.P(data_rng))
Use Excel to calculate Z Score and probability
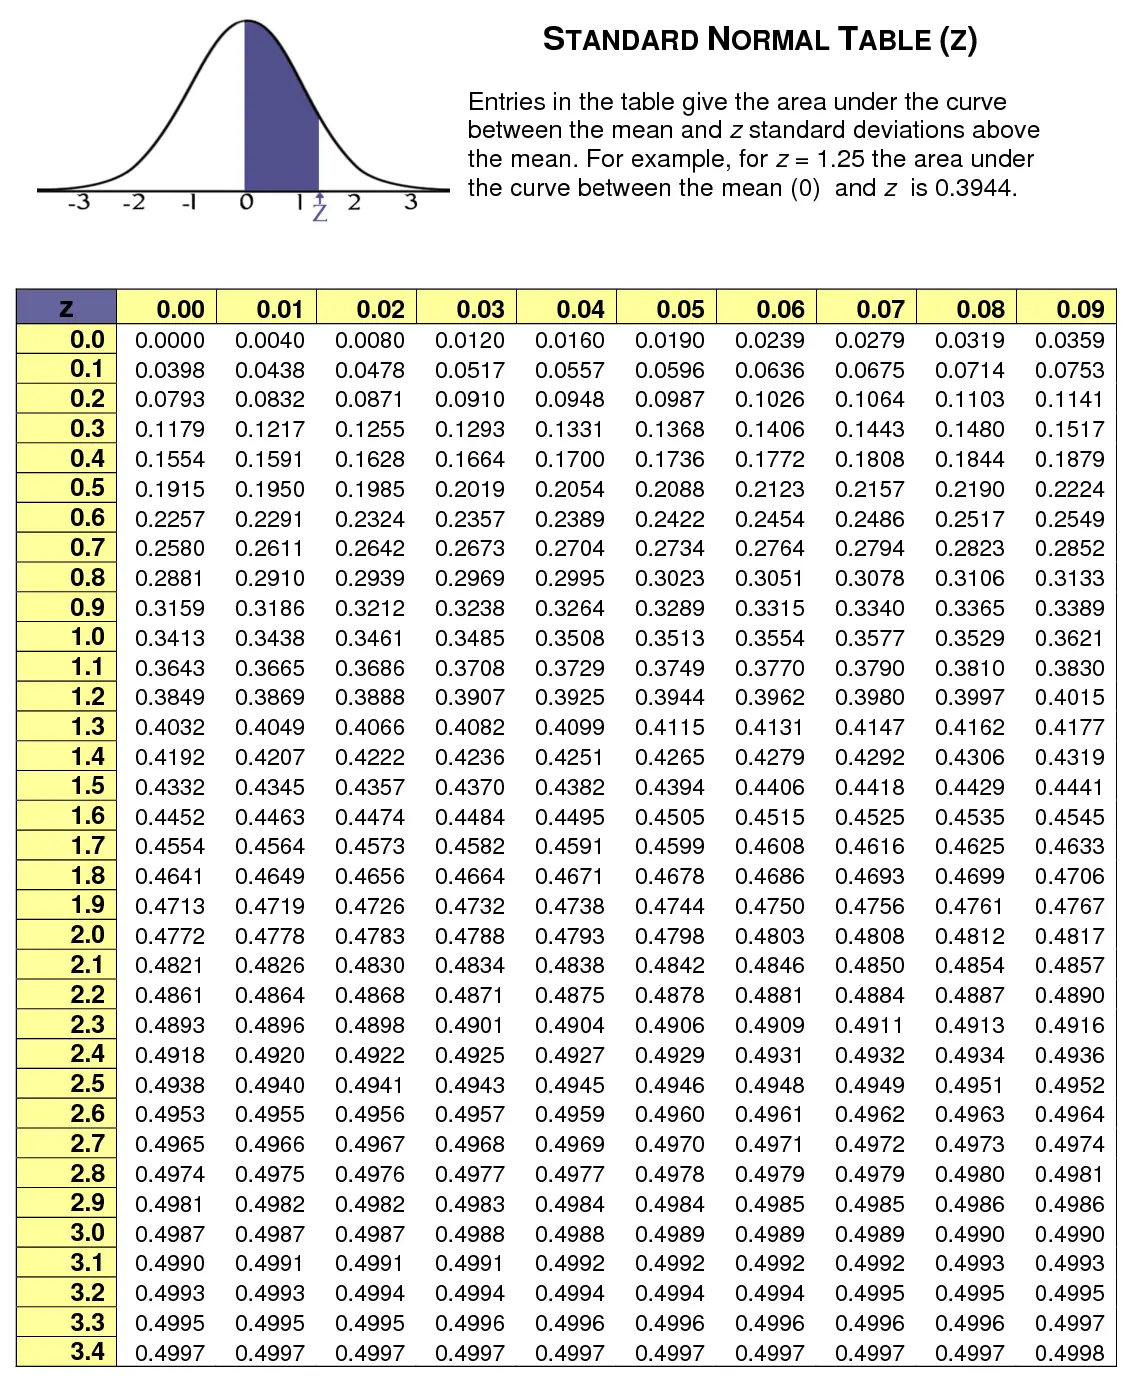
How Excel calculates probability is different from the Standard Normal Table. Standard Normal Table finds the probability from 0 to Z, while Excel calculates from infinity to Z.
Therefore, if you are trying to get the same result as Standard Normal Table does, subtract 0.5 by the Excel result and then apply absolute value.
For example, for Z score = 2.41, probability = 0.492 according to the Standard Normal Table. In Excel, the probability is 0.07869, which is approximately equal to 0.5-0.492.
| Data | Z Score | P value (Excel) | 0.5-P value | =ABS(0.5- P value) |
| 1 | -1.4142 | 0.0786 | 0.4214 | 0.4214 |
| 2 | -0.7071 | 0.2398 | 0.2602 | 0.2602 |
| 3 | 0.0000 | 0.5000 | 0.0000 | 0.0000 |
| 4 | 0.7071 | 0.7602 | -0.2602 | 0.2602 |
| 5 | 1.4142 | 0.9214 | -0.4214 | 0.4214 |
Method 1: Use NORM.S.DIST to convert Z score to probability
Syntax of Norm.S.DIST Function
NORM.S.DIST(z,cumulative)
| Z | Required. The value for which you want the distribution. |
| Cumulative | Required. Cumulative is a logical value that determines the form of the function. If cumulative is TRUE, NORMS.DIST returns the cumulative distribution function; if FALSE, it returns the probability mass function. |
This method directly converts Z Score to probability. Assume that we have already found Z Score, which is 1
=NORM.S.DIST(1,TRUE)
Assume that we haven’t found the Z score for X=10, then
=NORM.S.DIST(STANDARDIZE(10,AVERAGE(data_rng),STDEV.P(data_rng)),TRUE)
Method 2: Use NORM.DIST to calculate probability directly
Syntax of Norm.DIST Function
NORM.DIST(x,mean,standard_dev,cumulative)
| X | Required. The value for which you want the distribution. |
| Mean | Required. The arithmetic mean of the distribution. |
| Standard_dev | Required. The standard deviation of the distribution. |
| Cumulative | Required. A logical value that determines the form of the function. If cumulative is TRUE, NORM.DIST returns the cumulative distribution function; if FALSE, it returns the probability mass function. |
This method assumes that we still have not found the Z score yet. Assume that X=10
=NORM.S.DIST(STANDARDIZE(10,AVERAGE(data_rng),STDEV.P(data_rng)),TRUE)
Use SPSS to calculate Z Score and probability
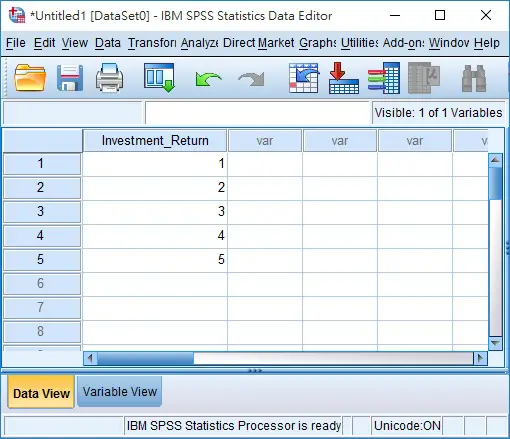
Input the value 1 to 5 in SPSS Data View.
Navigate to Analyze > Descriptive Statistics > Descriptives
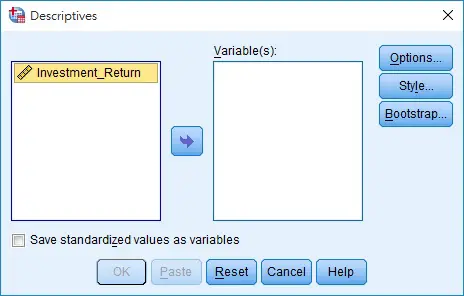
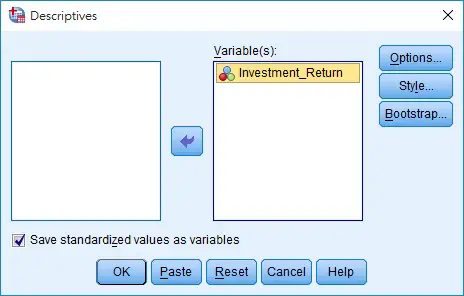
Move the variable to the right and check the box “Save standardized values as variables”
Close the Statistics Viewer (because we don’t need this) and go back to Data View.
Now we see a new column is created, which is the Z value for each data.
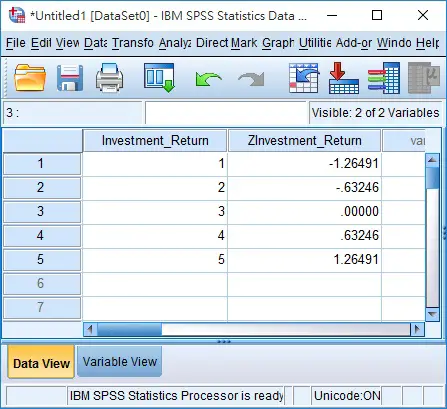
Lets compare SPSS result with Excel result, we can see that SPSS is using sample standard deviation to calculate Z Score (SPSS always uses sample instead of population).
After calculating the Z Score in SPSS, you can use Excel or refer to Standard Normal Table to find the probability.
Excel vs SPSS – calculate Z Score and probability
- SPSS fails to calculate Z Score for variable value not in the data set, while Excel can calculate any value
- SPSS can only calculate Z Score using sample standard deviation but not population standard deviation, while Excel can do both
- SPSS fails to convert Z Score to probability, while Excel can do
- SPSS fails to directly calculate Z Score from data set, while Excel can do