This Excel tutorial explains the meaning and calculation of Covariance and Coefficient of Correlation.
You may also want to read:
Excel Range, Variance, Standard Deviation
Covariance, Coefficient of Correlation
Assume that we have two sets of data – English and Mathematics results for each student. How can we tell whether English result has any relationship with Mathematics result?
| Name of Student | English Result | Math Result |
| John | 50 | 60 |
| Mary | 60 | 70 |
| Peter | 70 | 80 |
To answer the question, we need Covariance and Coefficient of Correlation, which measure the linear relationship of two variables.
Covariance
The purpose of Covariance is to measure the direction of the relationship, whether the relationship is positively correlated (x increases when y increases) or negatively correlated (x decreases when y increases).
The value of Covariance does not make much sense; lets say the Covariance is 100, does it mean the correlation is very strong? No, because it is not comparing to any value.
We only need to know whether it is positive or negative, Covariance is more important for further calculation of Coefficient of Correlation (we will discuss below).
Below is the formula of Sample Covariance. (Similar to Standard Deviation, replace N with n-1 for Population Covariance)
Calculate Covariance in Excel
There are two Functions for Covariance:
Covariance.P (array1, array2) - Used for Population Covariance
Covariance.S (array1, array2) - Used for Sample Covariance
Using the example of English result and Math result
| Formula | Result |
| =COVARIANCE.P(B2:B4,C2:C4) | 66.66667 |
Coefficient of Correlation
Coefficient of Correlation measures the relative strength of the linear relationship between two variables. Put it simply, it is a numerical value to measure how strong the relationship is. The larger the value, the stronger the relationship.
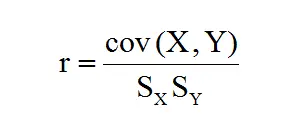
Coefficient of Correlation is denoted by a Greek symbol rho, it looks like letter r. To calculate Coefficient of Correlation, divide Covariance by Standard Deviation of two variables (Sx, Sy).
Coefficient of Correlation ranges between -1 and 1.
r = -1 : Perfect Negative Correlation
r = 0 : No Correlation
r = 1 : Perfect Positive Correlation
Calculate Coefficient of Correlation in Excel
Correl (array1, array2)
Using the example of English result and Math result
| Formula | Result |
| =CORREL(B2:B4,C2:C4) | 1 |


