
This Excel tutorial explains how to use mean, mode and median to measure Central Tendency.
Excel Central Tendency
Central Tendency is a statistics term to describe the central point of probability distribution. Central Tendency can be measured by mean, mode and median. This tutorial explains how to use Excel to measure mean, mode and median using Excel formula.
Arithmetic Mean
Definition
Arithmetic Mean is also known as mean or average. Simply speaking, it is sum of all numbers and then divide by how many numbers that you have summed.
There are two kinds of mean in statistics – population mean and sample mean, represented by the following notations.
 = population mean
 = sample mean
Population mean is to average all numbers, while sample mean is to average part of the population. For example, we want to study if U.S. citizens like Obama, apparently we cannot ask everyone in the U.S., instead we just ask some of the people (sample) and then use the result to estimate how all the U.S. citizens (population) think.
Excel
In Excel, use the Function Average to calculate mean.
For example, from cell A1 to A6, we have the following data set.
| 1 | 2 | 3 | 4 | 5 | 6 |
The mean of these numbers =AVERAGE(A1:F1)
The result is 3.5
If you try to apply filter and then calculate average value, use Subtotal Function to do that.
Median
Definition
Place all the observations in order (ascending or descending) and find the data in the middle point.
If the number of observations is odd number, we can easily find the middle point. In the below example, 3 is the median.
| 1 | 2 | 3 | 4 | 5 |
If the number of observations is even number, sum up the two values closest to the middle point and then divide by 2.
In the below example, median = (3+4)/2 = 3.5
| 1 | 2 | 3 | 4 | 5 | 6 |
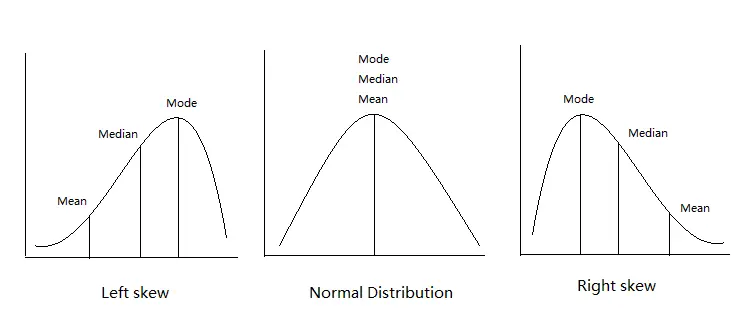
Most of the surveys use Median instead of Average, for example, household income. The reason is that we want to avoid extreme cases such as Bill Gates’s income, which would shift the average income higher than our expectation (See the below right skew diagram). Therefore median is a better measurement of central tendency for this case.
Excel
Given a data set from Range A1 to A6 as below
| 1 | 2 | 3 | 4 | 5 | 6 |
Apply formula =Median(A1:A6)
The result is 3.
Note that you don’t have to sort the data yourself before you apply Median, just select the range of data.
Mode
Definition
Mode is the most frequently occurring value in the data set.
Excel
In Excel, use Mode Function to find Mode.
For example, from cell A1 to A6, we have the following data set.
| 1 | 1 | 1 | 2 | 2 | 3 |
Apply formula =Mode(A1:F1)
The result is 1
Outbound References
https://statistics.laerd.com/statistical-guides/measures-central-tendency-mean-mode-median.php