
This Microsoft Access tutorial explains how to create Crosstab Query and demonstrate how to add grand total.
You may also want to read:
Create Matrix Report in Access Report
Access replace Crosstab Query with Expression
Excel VBA Convert Text in Columns and Rows into Matrix Table
Access Crosstab Query
Crosstab Query is a Matrix Report, the most commonly known Matrix Report is Excel Pivot Table, where you can place fields in row and column, and then apply Aggregate Functions on a field value such as Count, Sum, Max.
In newer version of Microsoft Access, Pivot Table function has been removed, you can only create Matrix Report through Crosstab Query, or write expression in Access Report. However, Crosstab Query cannot be a substitute of Pivot Table because Crosstab Query only allows one field as column header, where Pivot Table allows multiple levels. Crosstab Query also only allows one aggregate function on a field value, but Pivot Table allows multiple aggregate functions on multiple field values in a single Pivot Table.
After you have created a Crosstab Query, it can be used as the Record Source in Access Report. While it is also technically possible to manually create Expressions to form a Matrix report in Access Report, it is easier to do it in Crosstab Query first.
Create Access Crosstab Query
Access Crosstab Query can be created through Query Wizard, but it is unnecessary because it is easy to create one in Query Design if you understand how to use Group By.
Suppose we have a payroll history table a below
| Employee_ID | Department | Pay_Date | Amount |
|---|---|---|---|
| 001 | Admin | 1/1/2017 | 10000 |
| 001 | Admin | 1/2/2017 | 10000 |
| 001 | Admin | 1/3/2017 | 10000 |
| 001 | Admin | 1/4/2017 | 10000 |
| 001 | Admin | 1/5/2017 | 10000 |
| 001 | Admin | 1/6/2017 | 10000 |
| 001 | Admin | 1/7/2017 | 10000 |
| 002 | Finance | 1/1/2017 | 20000 |
| 003 | Finance | 1/1/2017 | 500 |
| 003 | Finance | 1/2/2017 | 500 |
| 003 | Finance | 1/3/2017 | 500 |
| 003 | Finance | 1/4/2017 | 500 |
| 003 | Finance | 1/5/2017 | 500 |
| 003 | Finance | 1/6/2017 | 500 |
| 003 | Finance | 1/7/2017 | 500 |
| 003 | Finance | 1/8/2017 | 500 |
| 002 | Finance | 1/2/2017 | 20000 |
| 002 | Finance | 1/3/2017 | 20000 |
| 002 | Finance | 1/4/2017 | 20000 |
| 002 | Finance | 1/5/2017 | 20000 |
| 002 | Finance | 1/6/2017 | 20000 |
| 002 | Finance | 1/7/2017 | 20000 |
| 002 | Finance | 1/8/2017 | 20000 |
Our goal is to analyze how much salary is paid out for each department in each month.
Navigate to Create > Query Design > add table payroll_history
Under Design tab, click on Crosstab
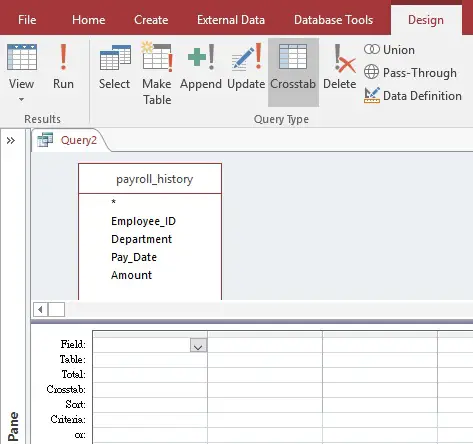
Similar to Excel Pivot Table, we need to design what fields we want to place on the left hand side (known as column heading) of the report and what field we want to put on the top (row heading) of the report. From a report design standpoint, we do not want many items to display on row heading while we do not care how many items are in the column heading, because when we print out the report on a paper, the width of the paper size is limited but we can print multiple pages even though the column heading contains a lot of items.
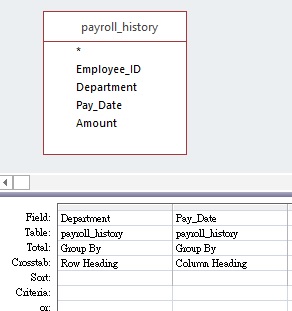
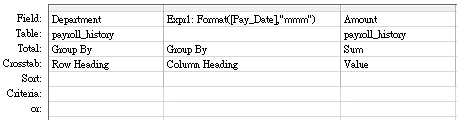
In our example, we do not have control over the number of departments in the future, but number of months is only limited to 12, so we would put Department field as Row Heading while Pay_Date field as Column Heading.
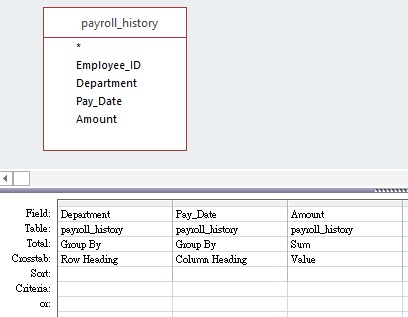
The next question is to think about what aggregate function we want to use for the values in the matrix. Because we need to sum up the amount of salary, we select Sum in the Total, and we select Value in Crosstab. Only one Value is allowed in each Crosstab Query, meaning we cannot apply multiple aggregate functions on different fields.
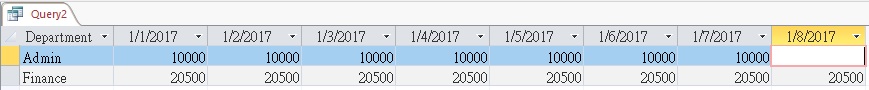
Run the Query. The column header is not grouped by month (it is grouped by date), so we need to use an Expression to transform date to month.
Go back to Query Design, use Format Function (it is like the Text Function in Excel) to format the Pay_Date field to display month.
Run the Query. We have fixed the month problem, but now the header is sorted in ascending order, moreover, it does not display months that do not have salary.

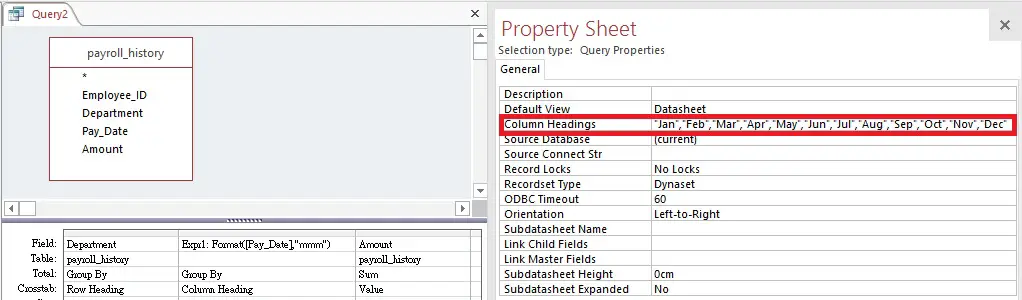
Define order for Column Headings in Crosstab Query
Back to Query Design, in the Property Sheet, type the exact header order in Column Headings. If you type something that cannot be found in the Query result (e.g. Dec amount), the value will display blank for that column, therefore you can type the months of the whole year.
Run the Query to see the full year result in ascending month order.

Add more than one grouping in Crosstab Query
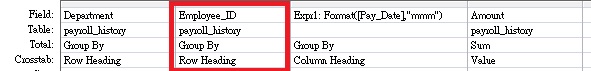
Similar to Pivot Table, you can add more than one Group By for Row Heading. For example, if we want to first Group by Department, then Group by Employee_ID, then add one more Row Heading.
Result

While we can add multiple Group By for Row Heading, we can only have one level of Column Heading.
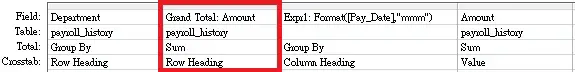
Add grand total in Crosstab Query
Adding grand total for each grouping is through adding the 2nd Group By but apply aggregate function on that grouping.
To express this in Query Design
Result
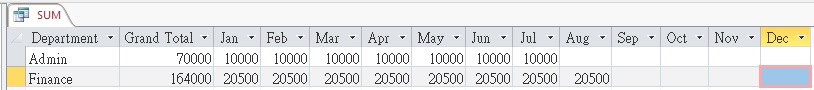
As explained, the Grand Total column is a Group By, therefore it must be placed between Row Heading column and the first Value column. It cannot be moved the the right hand, the end of the month in Query Design, but you can move it to the back in Query View.
Final Thoughts
Crosstab Query can make the report easier to read, but it definitely has more constraints in terms of building Expression on the “Value”. Because normal Query can fully achieve the grouping you need using Group By, I highly recommend you not to use Matrix Report if your requirement is complicated. Read my another post to see how to use Expression to build a Matrix Report.
