This Microsoft Access tutorial explains how to create Matrix report in Access Report using Crosstab Query and Expression.
You may also want to read:
Excel VBA Convert Text in Columns and Rows into Matrix Table
Access Matrix Report
Matrix Report is like an Excel Pivot Table, where you can place fields in row and column, and then apply Aggregate Functions on a field value such as Count, Sum, Max. In newer version of Microsoft Access, Pivot Table function has been removed, you can only create Matrix Report through Crosstab Query, or write expression in Access Report.
In this post, I will demonstrate how to use both methods to create Matrix Report in Access Report.
Create Matrix Report in Access Report – using Crosstab Query
Suppose you have created a Crosstab Query below (refer to my previous post)
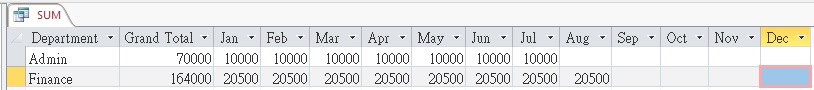
Run or select the Query, navigate to Create tab > Report

A report is generated using the Crosstab Query “SUM” as Report Record Source.

Do some resizing of text box and formatting of fonts, now the Report looks exactly the same as Crosstab Query.
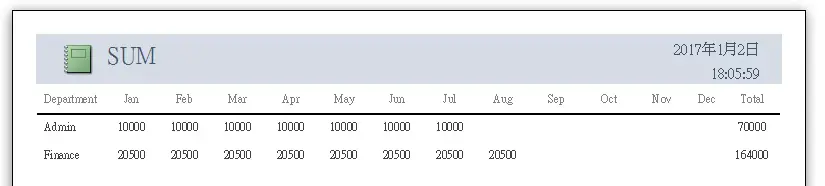
This is the simplest way to create Matrix Report in Access Report. However this Report lacks flexibility, because you cannot do further Group By or calculation, unless you change the Crosstab Query.
Create Matrix Report in Access Report – using Expression
Create a new Report. Instead of using Crosstab Query as Record Source of Report, use the original table “payroll_history” without any manipulation, because you can do everything in Expression.
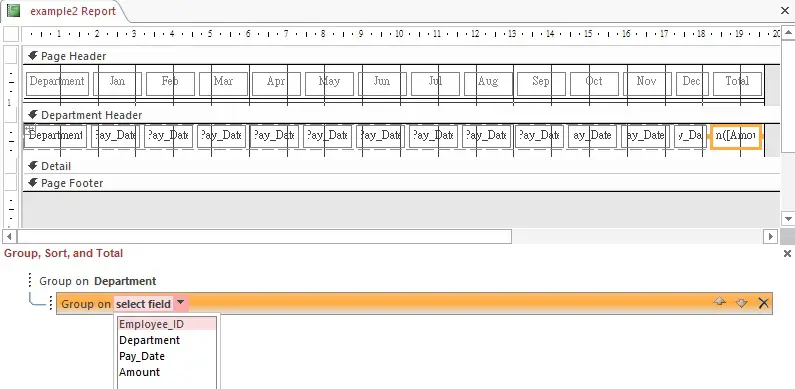
Group the Report by Department.

Under Department Header, for January Text Box, type Expression
=Sum(IIf(Month([Pay_Date])=1,[Amount],0))
For Feburary, type Expression
=Sum(IIf(Month([Pay_Date])=2,[Amount],0))
Continue with the same logic until December, for Total Text Box, type Expression
=Sum([Amount])
Now Run the Report, you have the same result as using Crosstab Query as Record Source.
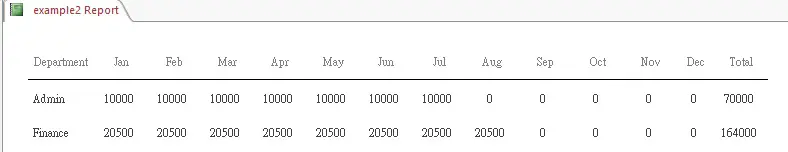
Because this Report is using payroll_history as Record Source (the original data source), you can do more Group By, do different sorting and do more IIF statement in the Expression than using Crosstab Query.
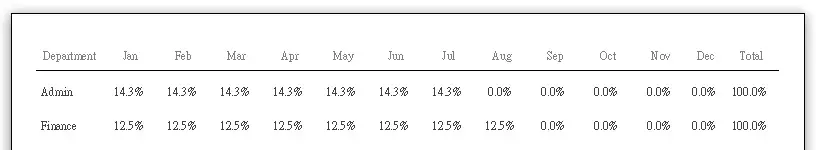
Calculate Percentage of Total
Instead of displaying the total amount for each month, we can display percentage of total.
Using the previous example2 Report
We just need to divide the amount of each month by the total amount.
Under Department Header, for January Text Box, type Expression
=Sum(IIf(Month([Pay_Date])=1,[Amount],0))/Sum([Amount])
For Feburary, type Expression
=Sum(IIf(Month([Pay_Date])=2,[Amount],0))/Sum([Amount])
Continue with the same logic until December, for Total Text Box, type Expression
=Sum([Amount])/Sum([Amount])
Select the Text Box as below, and then change the Format field to Percent, and type 1 for Decimal Places field.
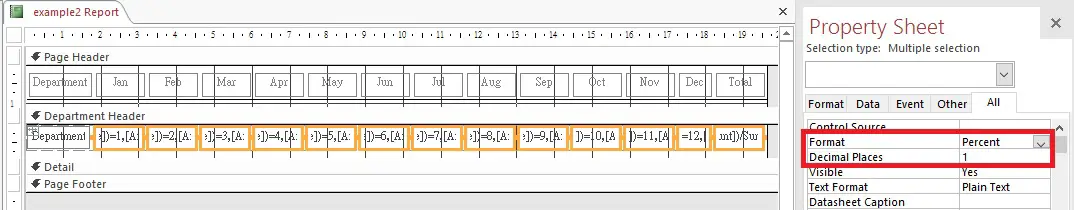
Run the Report