
This tutorial explains how to use Excel and SPSS to perform one sample T Test.
You may also want to read:
Calculate Z Score and probability using SPSS and Excel
What is T Test
In statistical inference, we are interested to know whether a small sample comes from a population. To inference using sample mean, when the population standard deviation and population mean are known, we can use Z test to interference the population mean from sample mean.
In reality, we do not have data of the whole population. Without the population standard deviation, we use T Test (also known as Student’s t Test) to interference the population mean from sample mean.
There are basically three kinds of T Test in statistics:
| One sample T Test | Test whether a target mean value is equal to the population mean |
| Independent samples T Test | Test whether the population mean from two individual samples are equal |
| Paired-samples T Test | Test whether the population mean between paired observations are equal |
This tutorial will only talk about One sample T Test.
One sample T Test – manual calculation
Formula
t value of particular test mean value
![]()
x bar: sample mean
μo: population mean to test
s: sample standard deviation
n: sample size
Confidence interval estimator of population mean (the value range of population mean at particular confidence level α)
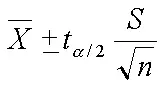
Degree of freedom (ν)
ν = n-1
Example
To test whether population mean of student’s exam marks is over 50, given the below sample data
| Student ID | Average marks |
| 1 | 40 |
| 2 | 50 |
| 3 | 60 |
| 4 | 36 |
| 5 | 70 |
Step 1: Hypothesis
H1: μ > 50
Ho: μ = 50
Click here to learn more about Hypothesis Testing
Step 2: Calculate t of test mean value
![]()
sample mean = 51.2
sample standard deviation = 14.043
square root of sample size = 2.236
t = (51.2-50)/(14.043/2.236)
t = 0.191
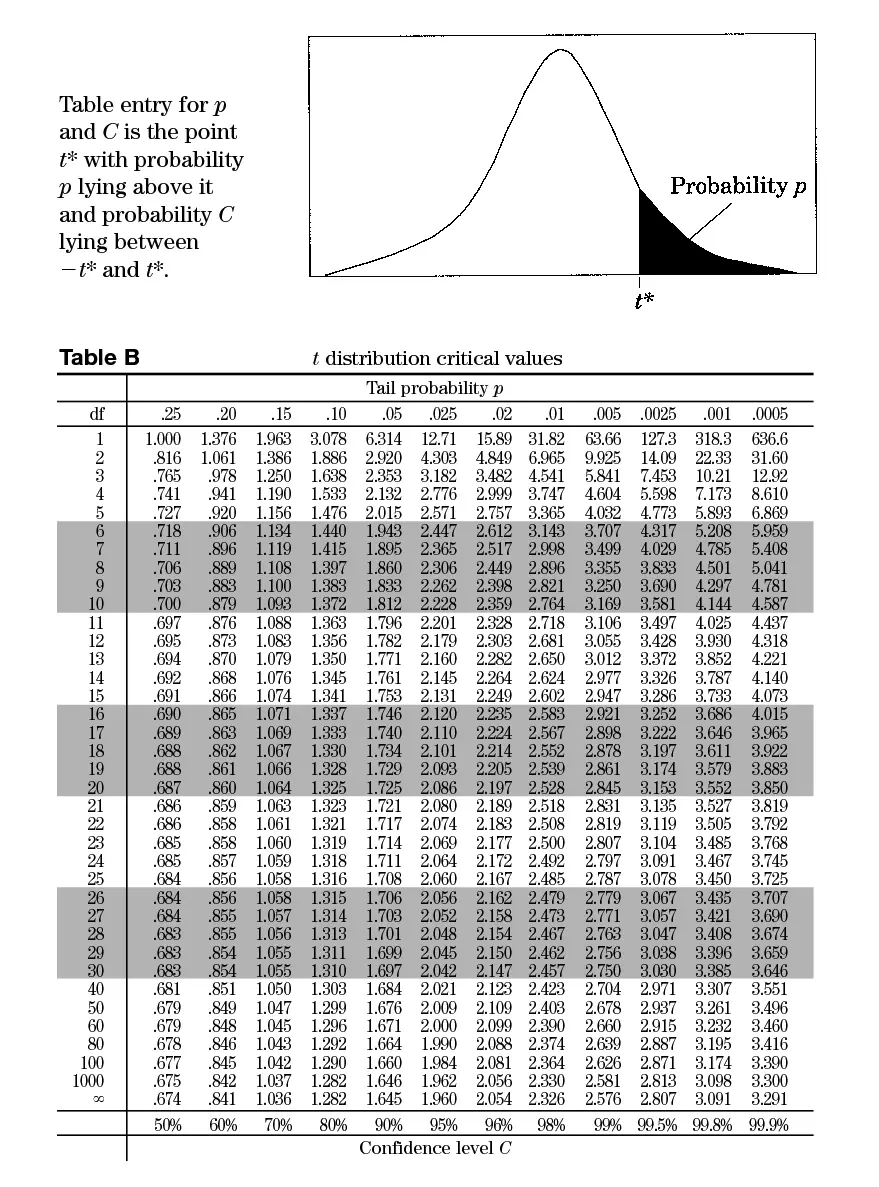
Step 3: Find t at 5% Significance level from t table
Find the t value for df = 4, p = 0.05 in t table
The value of t is 2.132
Conclusion
The rejection region is t > 2.132. Now that t for 50 is 0.191, therefore we do not have enough evidence to reject null hypothesis.
We can also calculate the confidence interval for our reference.
Interval = 2.571*14.043/2.236 = 16.15
Thus
Lower limit = 50-16.15 = 33.85
Upper limit = 50+16.15 = 66.15
One sample T Test – Excel
Create a spreadsheet as below. Column A is optional, column C is a dummy column to be used later as explained below.

In Excel 2010 / 2013, navigate to Data > Data Analysis
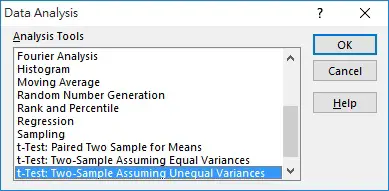
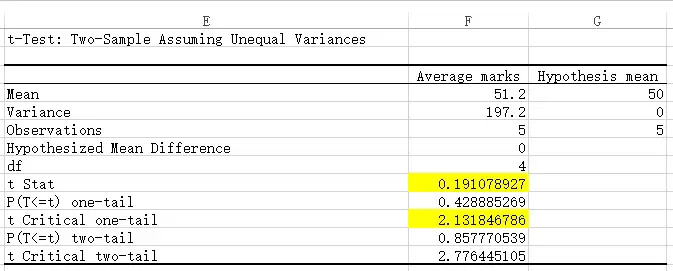
Since Excel does not have One Sample T Test, the closet we can use is t-Test: Two Sample Assuming Unequal Variances. We will compare column B with column C as a workaround.
Enter the information as below, and the click OK.
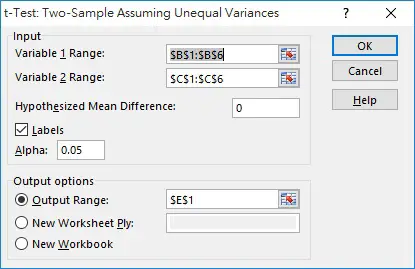
Variable 1 Range is your data source. Variable 2 Range is the hypothesis mean in this case.
Hypotheses Mean Difference is 0 because we just want to know if there is any difference, but not how much difference.
Labels means whether the first data of variable range is a header, which will be used in the output table.
Alpha is the significance level of one tail.
Output Range is where we want to output the result table.
This is the generated result table. I have highlighted the two T value for easy reference. They are same as manual calculation.
To find the confidence interval in Excel, navigate to Data > Data Analysis
Select Descriptive Statistics
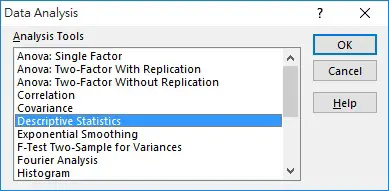
Input the value as below, click on OK

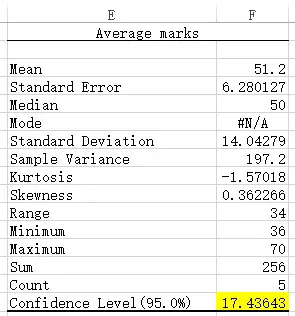
A table is generated. The value I highlight is the confidence interval, therefore
Lower limit = 50-17.44 = 32.56
Upper limit = 50+17.44 = 67.44
One sample T Test – SPSS
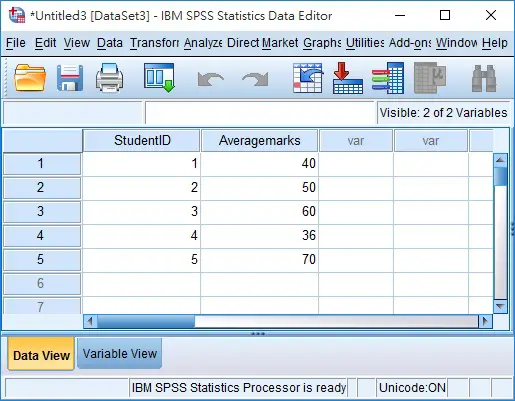
Navigate to Analyze > Compare Means > One-Sample T Test
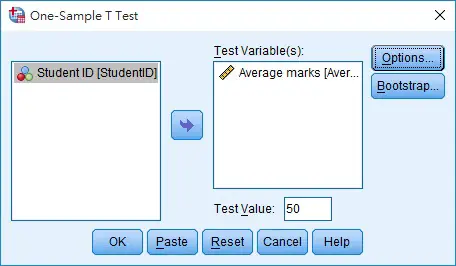
Move the average marks field to the right box for analysis, and then enter 50 as Test Value, click on OK.
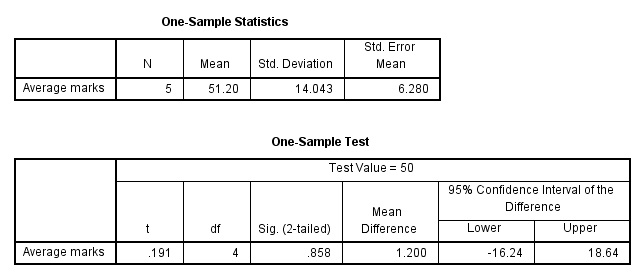
Interpreting the result:
| t | This is the t value for mean = 50 |
| df | degree of freedom equals to sample size-1 |
| Sig (2-tailed) | The total probability that mean > 50 and mean < 50 is 0.858 (probability not equal to 50). Since our hypothesis is testing mean > 50, we divide 0.858 by 2 = 0.429. Since 0.429 > 0.05 significance level, we cannot reject Null hypothesis. |
| Mean Difference | Difference between sample mean (51.2) and test value (50) |
| 95% Confidence Interval of the Difference | As we do not know the true mean of the population, from here we can estimate 95% chance that the mean would lie between 34.8 (51.2-16.24) and 69.84 (51.2+18.64). |
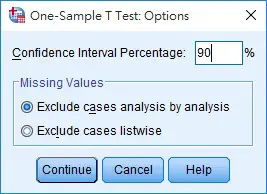
95% confidence level is the default value, to change the confidence level, go back to the One-Sample T Test box > click on Options button
You may change the confidence level right here
Outbound References
https://www.youtube.com/watch?v=tdaVp9BOdjk